Authored by: Bill Wessels, STLE – OMA I, CLS
The first time I saw an oil sample report, I was annoyed at how little information I was able to understand. This was not due to any deficiency in the report itself, but in my own understanding of information it provided. So now, with the rapid growth of companies adopting sampling programs to support initiative including extending drains and condition based maintenance practices, I think a brief discussion of interpreting oil analysis reports makes sense.
How’s the Oil Doing and What’s Happening with the Equipment?
At a basic level, a quick balance at an oil sample report can give us an indication of the condition of the oil itself and insight on any wear going on in the equipment. Most oil sample forms are divided into these two basic segments. The reports from ALS Tribology, the lab we use for third party testing, break the information down into five segments for most automotive lubricant sample reporting, see Fig. 1. The Metals and Contaminants sections help us gain insight into what’s happening within the component and connected systems. The Additives, Physical Tests, and Physical / Chemical sections give us a picture of how the lubricant is holding up at the time of the sample.
Figure 1 Virgin oil sample report
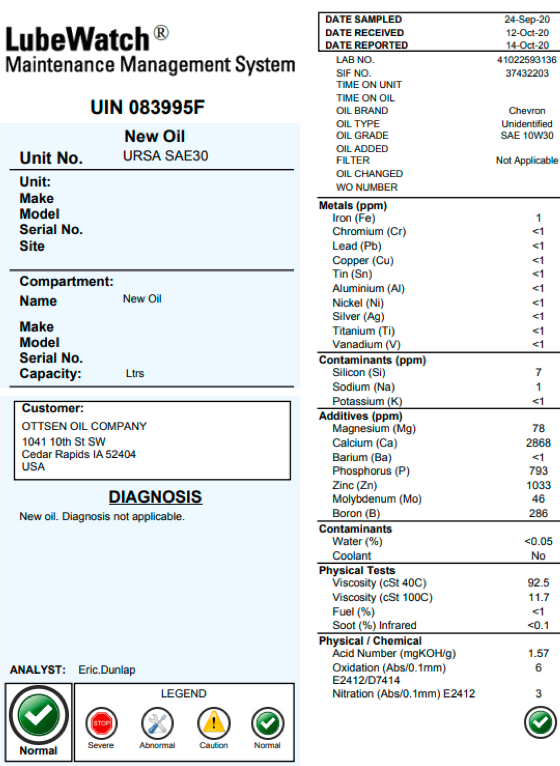 When reviewing a sample report for a diesel engine, for instance, I will first want to know about the lubricant itself. I will look at the header section that gives the information on the unit sampled, the miles on the unite and then the miles on the lubricant. This section will also tell us the brand, type and grade of lubricant sampled. This information gives me basic insight into what the additive numbers and viscosity should look like.
My next focus is on the Physical tests, I want to see if the oil is still with in grade. This is a measure of the oil’s viscosity at both 100C and 40C. For engine oils, we will focus on the measurement at 100C. A viscosity out of range, either high or low, by more than 10% is cause for concern. A drastic change in the oil’s viscosity can severely impact the ability of the oil to do its job. Too thick and it can cause excessive heat and reduce the flow within the system, too thin and the surface film suffers which can cause and increase of metal to metal contact resulting in wear.
I’ll then look at the soot and fuel dilution numbers, both can play a direct role in affecting the oils viscosity. A fuel or soot reading of 2% or greater needs looking into.
In the Physical / Chemical section of the ALS report form, we need to review the oxidation number. This number is the key to understanding how much time, if any is left in the life of the oil. While several issues can result in oil oxidation, once the oil is oxidized, it’s done. A number over 25 means the engine oil is near or at the end of its useful life for whatever reason and should be change out as soon as possible. If an oil is oxidizing early, look for the presence of water or issues with the cooling system that may be causing excessive heat. Also in this section we need to look at the TAN (Total Acid Number) or TBM (Total Base Number, also known as Reserve Alkalinity) numbers for a diesel engine oils sample. An increase of 2Mg/KHO or more for the acid number is a condemning limit as is a decrease of over 50% of the reserve alkalinity. It is rare that both tests are conducted on a sample.
A quick look at the Additive section will tell us if the additive profile is in line with the known profile for the oil sampled. Significant deviations from an add pack profile form a virgin oil sample should be noted and investigated. A future blog will cover the role add packs play in a lubricants performance and what may be rod causes for additive depletion.
Before we move on to the Metals section, we should first review the Contaminants section. Here we will find data on the levels of silicon(dirt), sodium, and potassium. Silicon levels above 20 are a problem as are the presence of sodium and potassium together, which indicate the intrusion of coolant into the oil system.
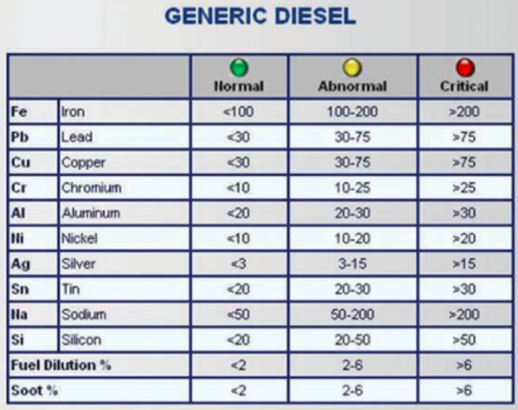
Once we’ve evaluated the condition of the oil itself, we can begin to look at what’s happening in the equipment. For this part of the evaluation, we move to the Metals section of the report. This section will give us an indication of any wear occurring with in the component. In this section, metals that make up common components within the equipment are listed along with a PPM count of those metals found in the oil sample. The table below gives general guidelines for limits on PPM levels of the various common wear metals. A more detailed discussion of wear meta, their sources and what it might mean are the subject of future blog posts.
As we have seen, a used oil sample report contains a great deal of information that gives us insight into not only the performance of the oil but also some indication of the condition of the equipment and integrated systems. As noted in this post, Ottsen will continue the discussion by delving deeper into the role additives play in an oil’s performance and reporting. We will also begin a look into wear metals and what we can learn from their presence in a sample report, stay tuned!
Have questions? Contact us HERE
Share to:
.png)